Debugger panel
Many of Godot's debugging tools, including the debugger, can be found in the debugger panel at the bottom of the screen. Click on Debugger to open it.
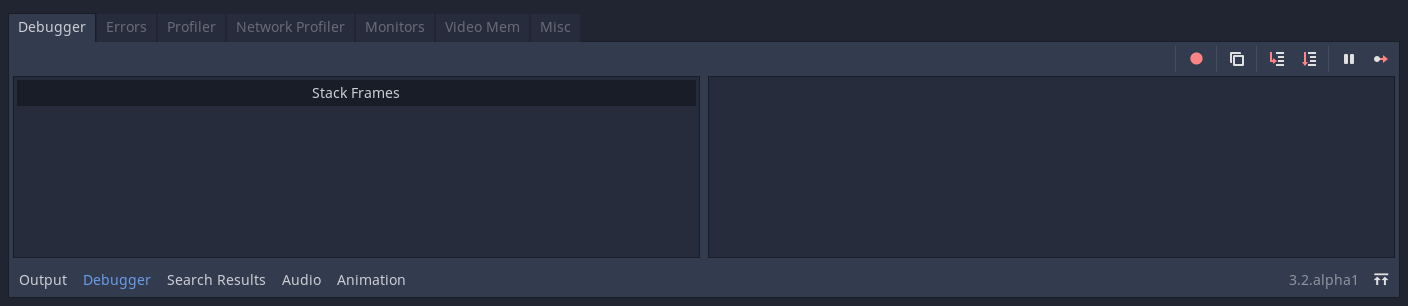
The debugger panel is split into several tabs, each focusing on a specific task.
デバッガー
The Debugger tab opens automatically when the GDScript compiler reaches a breakpoint in your code.
これは、stack trace、オブジェクトの状態に関する情報、およびプログラムの実行を制御するボタンを提供します。
You can use the buttons in the top-right corner to:
すべてのブレークポイントをスキップします。これにより、将来のデバッグセッションのためにブレークポイントを保存できます。
現在のエラーメッセージをコピーします。
ステップイン。このボタンを使用すると、次のコード行に移動し、そこが関数の場合は、関数内を1行ずつステップ実行します。
ステップオーバー。このボタンはコードの次の行に移動しますが、関数を1行ずつステップ実行しません。
ブレーク。このボタンは、ゲームの実行を一時停止します。
実行を継続。このボタンは、ブレークポイントまたは一時停止後にゲームを再開します。
警告
Breakpoints won't break on code if it's running in a thread. This is a current limitation of the GDScript debugger.
エラー
This is where error and warning messages are printed while running the game.
プロジェクト設定 > デバッグ > GDScript で特定の警告を無効にすることができます。
プロファイラ
デバッガには、プロセッサ、ネットワーク操作、およびビデオメモリ用の3つのプロファイラが付属しています。
プロファイラーは、個々のフレームが処理とレンダリングにかかる時間を示すために使用されます。
他のデバッグツールとは異なり、プロファイラーは自動的に起動しません。ゲームプレイ中に開始ボタンを押すといつでも開始できます。ゲームを開く前にプロファイラーを起動して、起動パフォーマンスをプロファイリングすることもできます。また、ゲームの実行中に、前回の実行時から情報を失うことなく開始および停止することができます。クリアをクリックするか、ゲームを閉じて再度開き、プロファイラーを再起動しない限り、記録された情報は消えません。
After starting and stopping the profiler, you should see things being kept track of on the left and a graph on the right. The items listed on the left are everything that contributes to frame time, and they should each have a value for time and calls for the current frame you are looking at.
右上のフレーム番号は、現在見ているフレームを示します。これを変更するには、上矢印または下矢印を使用するか、フレーム番号を入力するか、グラフをクリックします。
If you want to add something to your graph or think it looks too cluttered, you can check and uncheck the box next to an item to add or remove it from the graph.
ネットワークプロファイラー
ネットワークプロファイラーには、マルチプレイヤーAPIを介して通信するすべてのノードのリストと、各ノードについて、着信および発信ネットワークインタラクションの量に関するカウンターが含まれています。また、任意の時点での総帯域幅使用量を表示する帯域幅メーターも備えています。
モニター
モニターは、ゲームの複数の側面をグラフ化したもので、FPS、メモリ使用量、シーン内のノード数など、ゲームの動作を示します。すべてのモニターは統計を自動的に追跡するため、ゲームの実行中にモニターを1つも開いていなくても、後で開いて値の変化を確認できます。
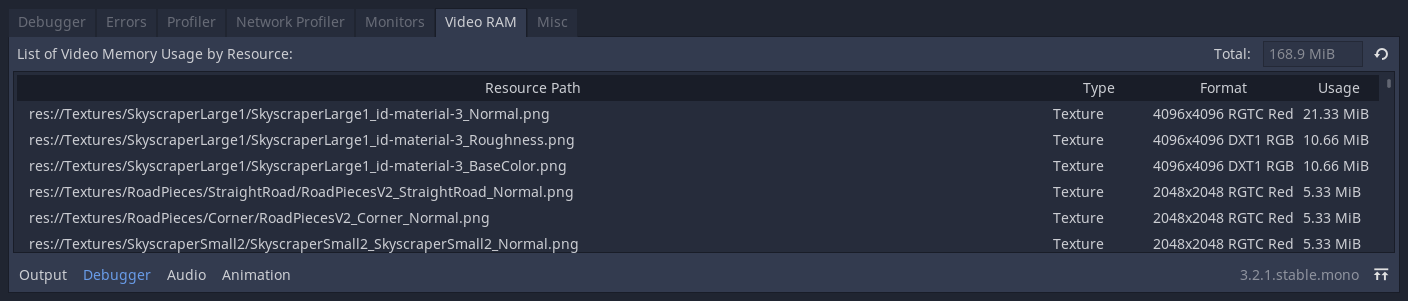
ビデオRAM
The Video RAM tab shows the video RAM usage of the game while it is running. It provides a list of every resource using video RAM by resource path, the type of resource it is, what format it is in, and how much Video RAM that resource is using. There is also a total video RAM usage number at the top right of the panel.
その他
[その他]タブには、実行時にクリックしているコントロールノードを識別するツールが含まれています:
クリックされたコントロール は、クリックされたノードがシーンツリーのどこにあるかを示します。
Clicked Control Type は、クリックしたノードのタイプを示します。